
You can add competitors to your new or existing Facebook page Trackers to add several new competitive reports to Facebook Trackers. Compare the performance of your Facebook page with your competitors' pages!
Depending on your plan level, you will be able to add 1 or more competitors (suites may track up to 10 competitors per Tracker).
Adding or editing competitors in your Tracker
When creating a Facebook Tracker, you'll notice a text box labeled "Competitors". Enter the Facebook page username of the competitors you would like to track, separating each competitor with a comma. Starter and Team plans can track up to 3 competitors per Tracker, and suites can track up to 10. When you add a new competitor, we'll backfill the past 28 days of a competitor's post and engagement information. Page likes (fans) will be collected going forward, but does not backfill.
You can update the competitors (add, change or remove) in a Tracker on the Tracker edit screen.
Tracker reporting
Competitors Summary
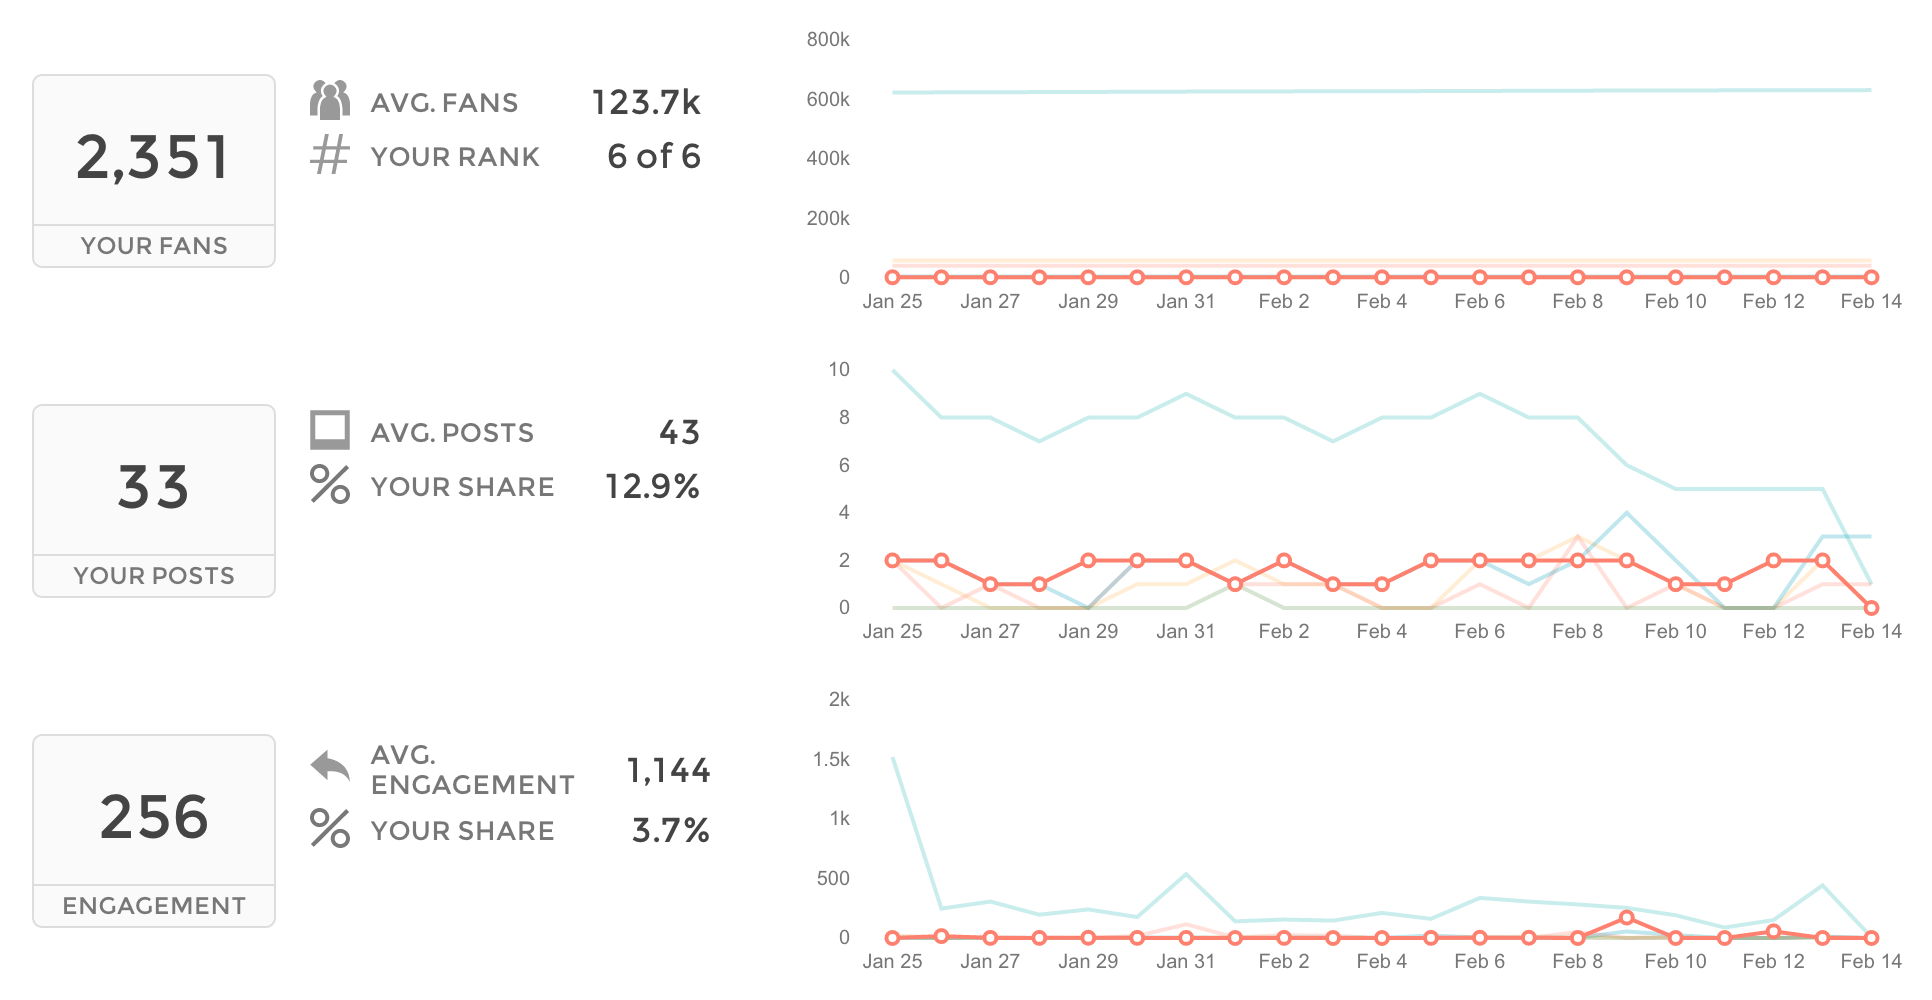
The competitors summary report includes an overview of your how your page measures up to your competitors' pages on several dimensions, including page likes (fans), posting frequency, and total engagement.
Fans. Your fans are shown in the first large box, next to the average number of fans for all pages (including yours and your competitors) and your rank relative to your competitors. Your page's fans are graphed as the bold coral color and your competitors are the lighter colors. Hover over any point in the graph to get details for that day or time.
Posts. Your posts for the current time period (our Trackers default to past 28 days, but you can change that with the calendar to the left) are shown in the first large box, next to the average number of posts for all pages and your share of the time period's total posts. Your page's posts are graphed as the bold coral color and your competitors are the lighter colors. Hover over any point in the graph to get details for that day or time.
Engagement. Your total engagement for the current time period (that includes reactions, shares and comments) are shown in the first large box, next to the average engagement for all pages and your share of the time period's total engagement. Your page's posts are graphed as the bold coral color and your competitors are the lighter colors. Hover over any point in the graph to get details for that day or time.
Competitive landscape. The competitive landscape graph plots your page and your competitors' pages against the average number of posts on the x-axis and engagement/post on the y-axis, for all pages being tracked. The size of the bubble corresponds to the number of fans a page has; large bubbles have more fans.

Top posts. We also include a list of the top posts from all pages, including yours, sorted by engagement received (including reactions, comments and shares). You can click on a post title, page name or thumbnail image to go to that competitor's detail page for more on that specific page's metrics. If you click on a post's timestamp, you'll be taken to that post on Facebook.
Ranking. Finally, we provide a list ranking you and your competitors by fans, posts and engagement. Use this table to see how you compare, and where you could improve.
Competitor Detail
Each of your competitors has a competitor detail report in your Tracker. Here you can see a page's overall fan count and growth over time, their posting behavior, and engagement rate, all compared to your own activity for quick benchmarking. There's also a posting behavior heatmap to show you when your competitor posts, and how that compares to when you post. The darker the block on the heatmap, the more frequently a page posts during that time. Hover over any block to get detailed metrics. The blocks with coral corner flags indicate that you also have posted during that time.
There are also a few summary metrics to help you quickly see how you compare to this competitor on some key area. Finally, we provide a list of all your competitor's posts from the time period, which you can sort by likes, comments, shares, or engagement received. If you click on a post's timestamp, you'll be taken to that post on Facebook.
Competitive Posts Summary
Use the competitive posts summary to see how frequently you post and how those posts measure up, relative to your competitors. First, the posts chart shows you the daily post counts of your page compared to your competitors.

Next, the posting behavior heatmap displays when you when you and your competitors post. The darker the block on the heatmap, the more frequently these pages post during that time. Hover over any block to get detailed metrics for which pages post then and how often. The blocks with coral corner flags indicate that you also have posted during that time.
Finally, all posts from all pages are listed in the table below. This shows you what was posted, when and the engagement it received. You can sort on any of those dimensions. Use this table to learn more about what your competition is posting and what's resonating with their audience. Maybe you can learn something about what to post (or not post)! If you click on a post's timestamp, you'll be taken to that post on Facebook.
Comments