
What is Union Metrics Echo?
Union Metrics Echo is a brand new feature of the Union Metrics Social Suite and allows you to instantly search and analyze tweets from any time in Twitter's history. You can search for anything that appears in a tweet - even things you aren't already monitoring with a Tracker. You can then zoom into different time periods, identify spikes in conversation, see what kinds of tweets were posted then, export your data, even convert it into a robust Tracker or historical report.
What can I search for?
Anything that shows up a in tweet - much like a Tracker. You can construct fairly complex boolean queries by combining multiple terms. We currently support these operators and queries:
- keyword
- "exact phrase match"
- keyword OR keyword
- keyword -keyword
- (keyword OR keyword) keyword
- from:username
- to:username
- @username
- #hashtag
There's no need to use the AND operator, as Echo will include those automatically between terms. Echo does support OR, however. You can chain together multiple terms with OR and (). For example,
#hashtagA OR #hashtagB OR (keyword1 keyword2) OR ("a phrase" (keyword3 OR "keyword4))
In an Echo session, you can compare up to five different search queries at once.
By default, we’ll start with a search going back the past 30 days. Upgraded plans can change the selected date range in the top right corner. Once you’ve selected a date range - or if you stay within the past 30 days - you’ll later be able to drill in further, so don’t worry about being too precise to start.
Once you like your term and date range, click the magnifying glass button to search. We’ll quickly display the tweet volume data for your search. From here, there’s a lot you can do.
- Add another search term to compare. You can add up to five different search terms in one Echo session. You can remove a term anytime by clicking on the X next to it.
- Zoom in to a more specific time period. You can grab the brush on the small top graph to narrow or widen your selected range, which will change the data displayed in the large graph below. Try zooming into a period of a few days or hours. You can also pan across the graph to change dates.
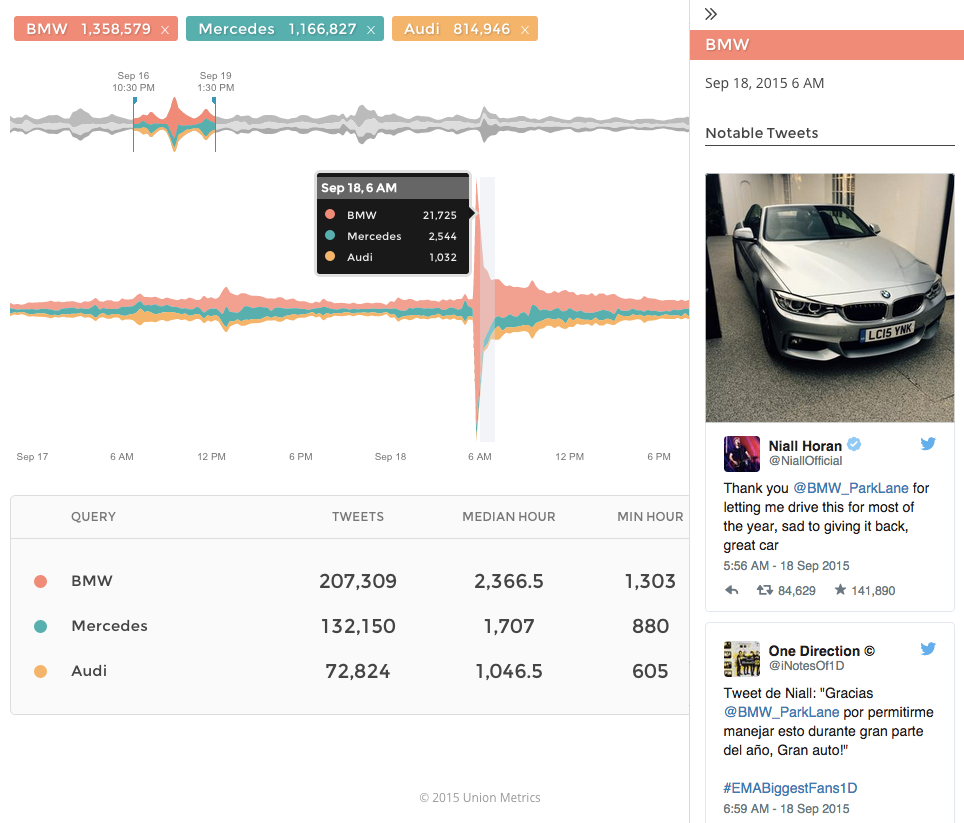
- Interact with the main focus graph. You can hover over the main graph to see details for a particular day, hour or minute. And if you click on a series in the graph, the tweet context pane will pop up on the right side to show you some of the most notable tweets from that time period.
- Export or share the data. If you click on the arrow icon in the top right corner, you’ll get a set of options to share your results, including downloading a detailed CSV export.
- Get more detail with a Tracker or report. Once you’re satisfied with the data in your main Echo view, you can create a more detailed Tracker or historical report from it. If your data ends at the current time, you can start an ongoing Tracker, which will backfill with the data you’ve selected, and start tracking new and future tweets in real time. If your data is from earlier, you can generate a one-off historical report. This will be in our Tracker format, but will be a static dataset created from the dates you’ve selected.
- Get more advanced with your searches. In our FAQ, we have more information about supported search terms and operators, as well as ideas for other things you can search for. Once you’ve got the hang of how the basic functionality works, try some more advanced queries!
Comments